



 +972 52-548-6969



NH Prof new featuresOverall usage and aggregated alerts
time to read 1 min | 135 words
Hat tip to Chad Myers for requesting those features.
Here is an example of the overall usage report for the entire application.
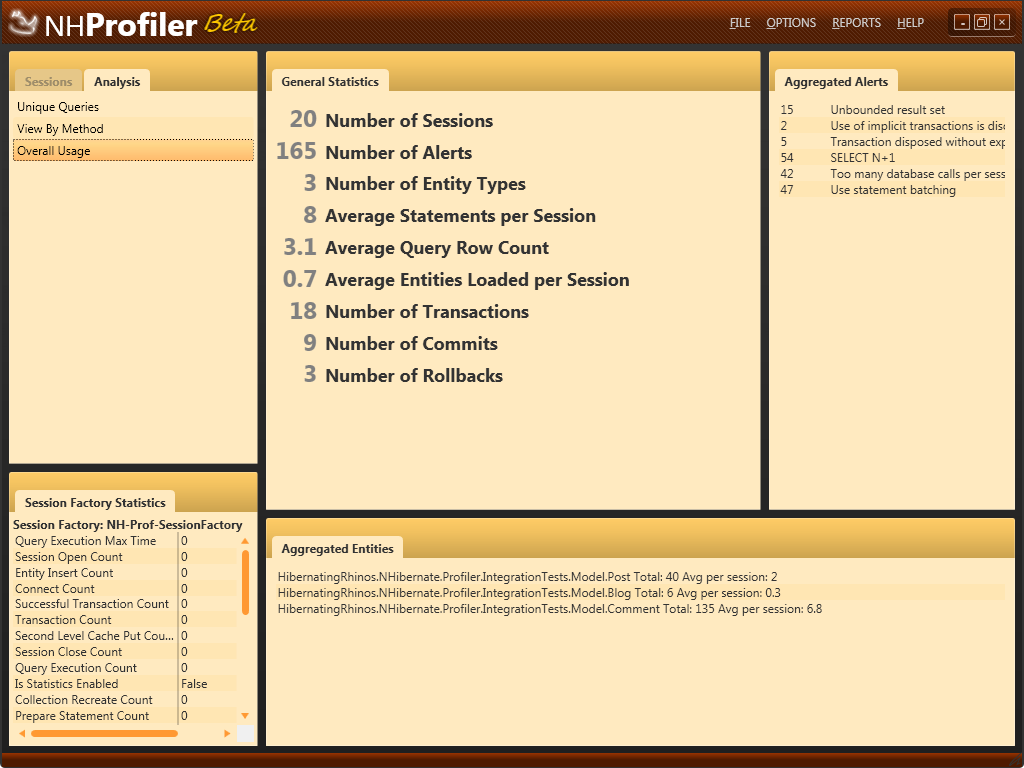
The aggregated alerts gives you a view about how your application is doing. As you can probably see, this isn't a very healthy application. But since this is actually showing the test suite for the profiler, I am happy with that. On the bottom, you can also see what entities where loaded throughout the entire profiling session, although this is not their final look & feel.
We can also see inspect the details of a particular session.

Again, this is probably not a healthy code base :-) But that is why I created the profiler for.
More posts in "NH Prof new features" series:
- (24 Jan 2009) Disabling & Ignoring Alerts
- (30 Dec 2008) Overall usage and aggregated alerts
- (22 Dec 2008) Analysis
Comments
Comment preview